Linear Regression From Scratch
A statistical measure that attempts to determine the strength of the relationship between one dependent variable and one or more independent variables is called regression. Regression analysis is widely used for prediction and forecasting.
What is Linear Regression?
Linear Regression is a method for predicting the value of a dependent variable ‘y’, based on the value of an independent variable ‘X’. There are two types: Simple Linear Regression and Multiple Linear Regression.
The equation of simple linear regression is: y = b + a*X + e
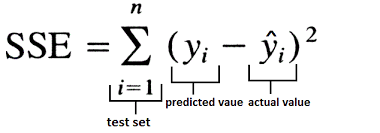
Figure 1: The sum of square formula
Implementation in Python
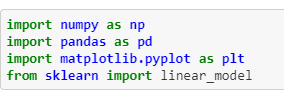
Here we import all the libraries: numpy for scientific computing, pandas for data wrangling, matplotlib for visualization, and sklearn for computing LinearRegression.
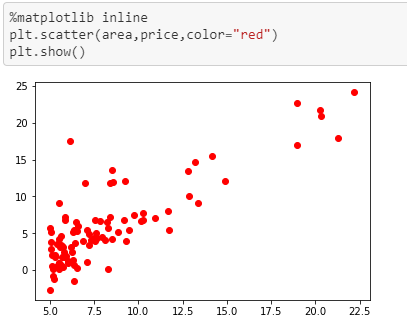
We plot our data using matplotlib. As the area of the house increases, the price also increases, showing a positive correlation.
Training the Model
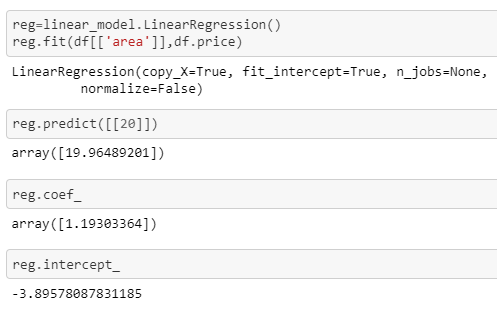
Using sklearn's LinearRegression, we fit our training data. The coefficient 'a' is approximately 1.19 and the y-intercept 'b' is -3.89.
Prediction
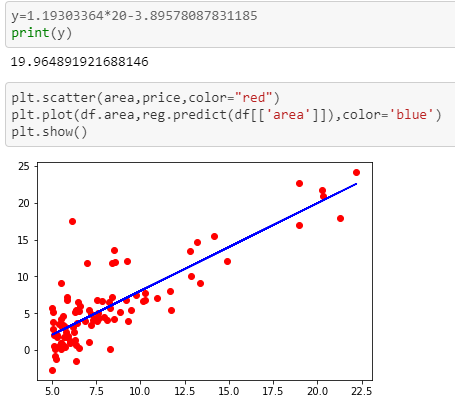
Finally, we predict the price for a given area and plot the best fit line.